
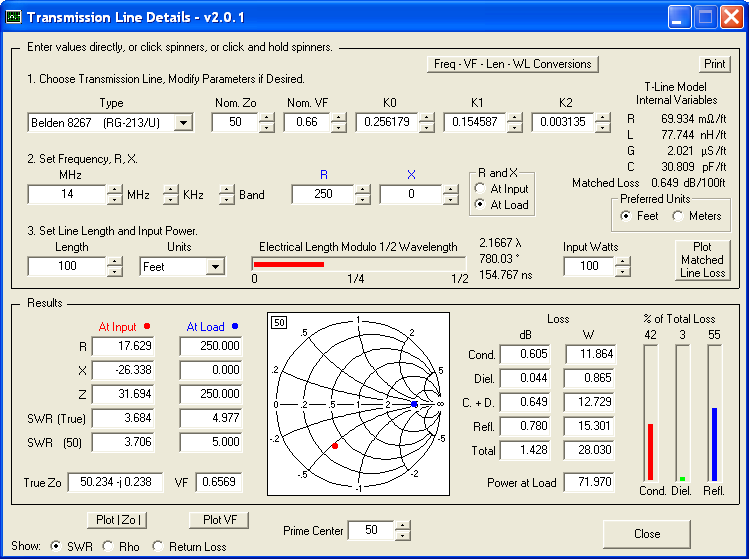
Experiment with transmission lines. Watch impedance points change on a Smith chart as you quickly vary input parameters using spin buttons. Plot matched line loss versus frequency.
Link !
Download:
Download TLDetails.zip. Free. Runs as a stand-alone Visual Basic program, does not require Excel.
Important: If you see an error message about «MSVBVM60.DLL» you will also have to download the complete Visual Basic runtime library. This is a large file so I don’t keep a copy on this site. You can get it directly from the Microsoft site. Alternatively you can download any one of the thousands of other applications that also use the Visual Basic runtime library, such as the free EZNEC Demo program.
Change history:
- Version 2.0.1, uploaded 28 November 2014.
- Smith chart gridline labels did not display correctly with large fonts.
- Version 2.0, uploaded 10 March 2011.
- Much more accurate mathematical model for transmission lines. The model includes the effects of DC resistance and internal inductance (due to magnetic fields within the conductors) as well as the usual skin effect resistance and external inductance (due to magnetic fields between the conductors) when doing the calculations.
- Plot function added for true Zo magnitude and true velocity factor across frequency ranges.
- Calculate and display distributed RLGC transmission line parameters.
- Calculate and display one-way time delay.
- Added several dozen more built-in line types. Updated specs for all line types to match current data from manufacturers’ web sites as of late 2010.
- Remove dependency on the FM20.DLL file. TLDetails is now just like any other stand-alone Visual Basic application.
- Slight change to the way that the characteristic impedance Zo is calculated.Version 1.1, uploaded 20 January 2007.
- Version 1.0, initial release, 10 June 2002.